
I’d been following Sara Arribas Colmenar on Bluesky since working with a University of Liverpool researcher on an (unsuccessful) proposal loosely inspired by Sara’s string art social network analysis. When I saw her post about the #DHmakes Mail Art Collaboration, I filled in the form, enticed by the lovely pieces of art I’m hoping to receive from the other participants!
Forward several weeks…
I’d worked on a Quipu Column for the CDC Festival of Data in Liverpool eariier this year and decided to make a mini version of that, mainly based on the maquette for the original piece. Here’s the result (it’s about 150mm tall):
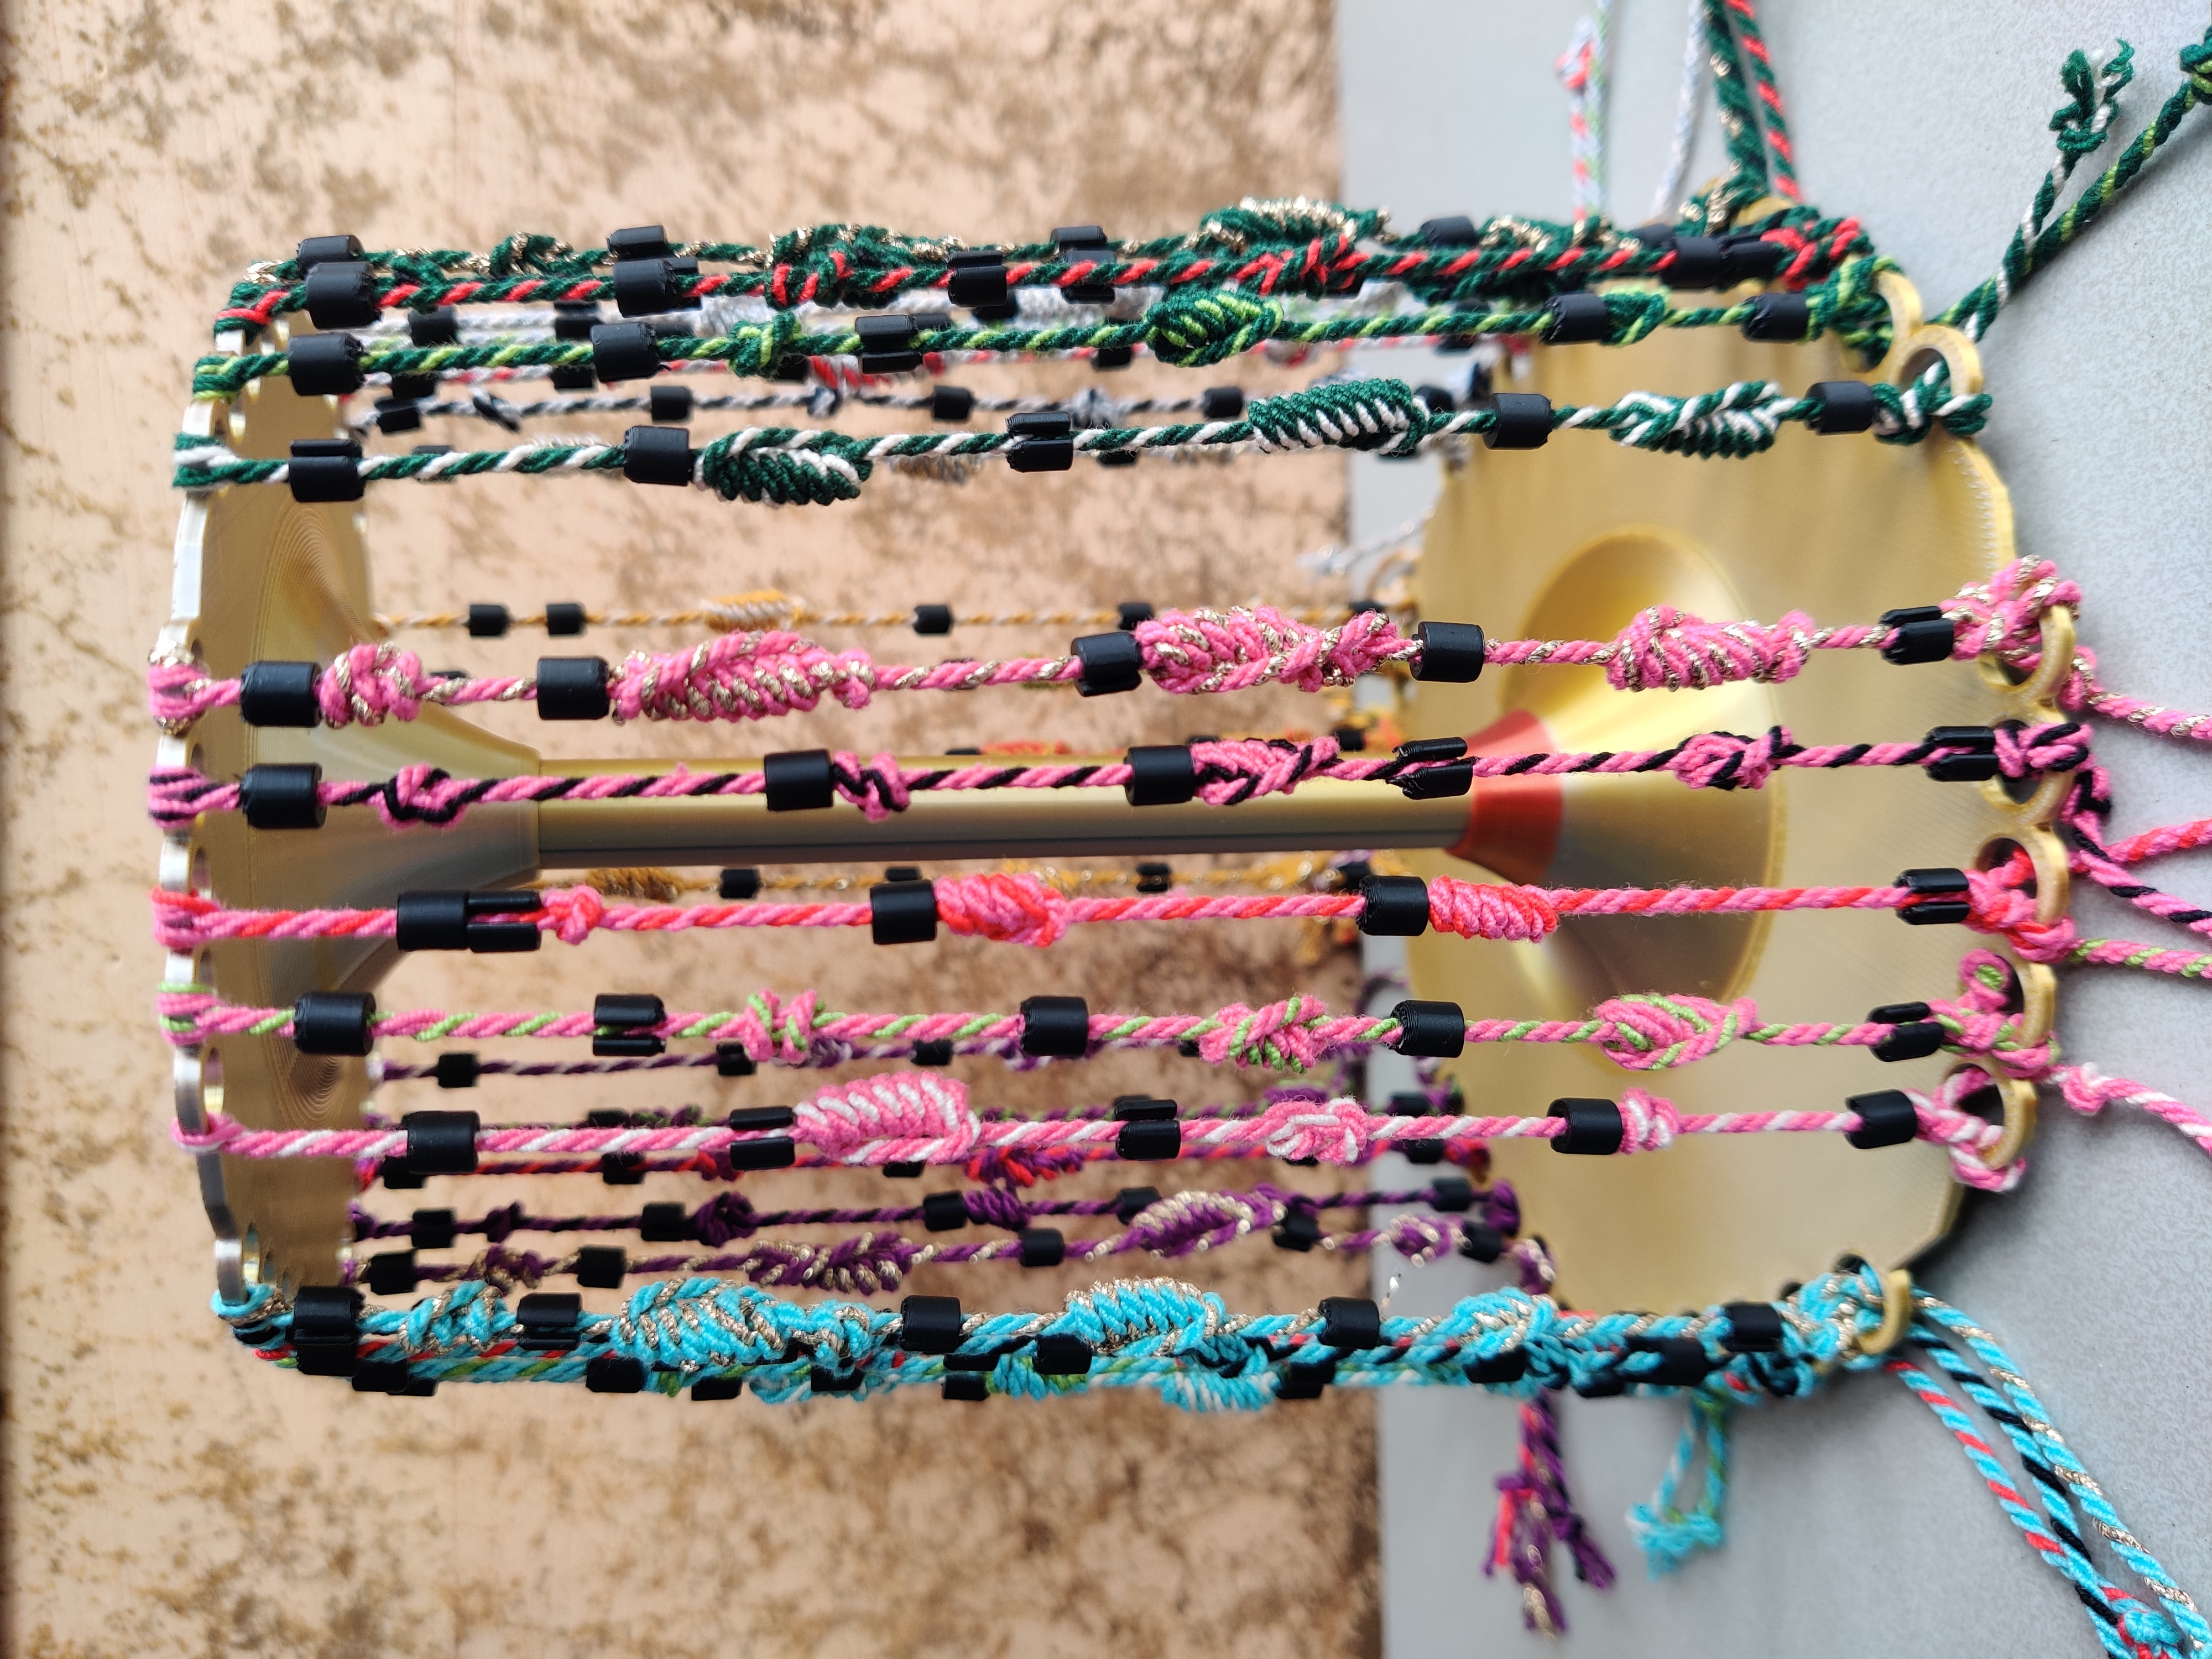
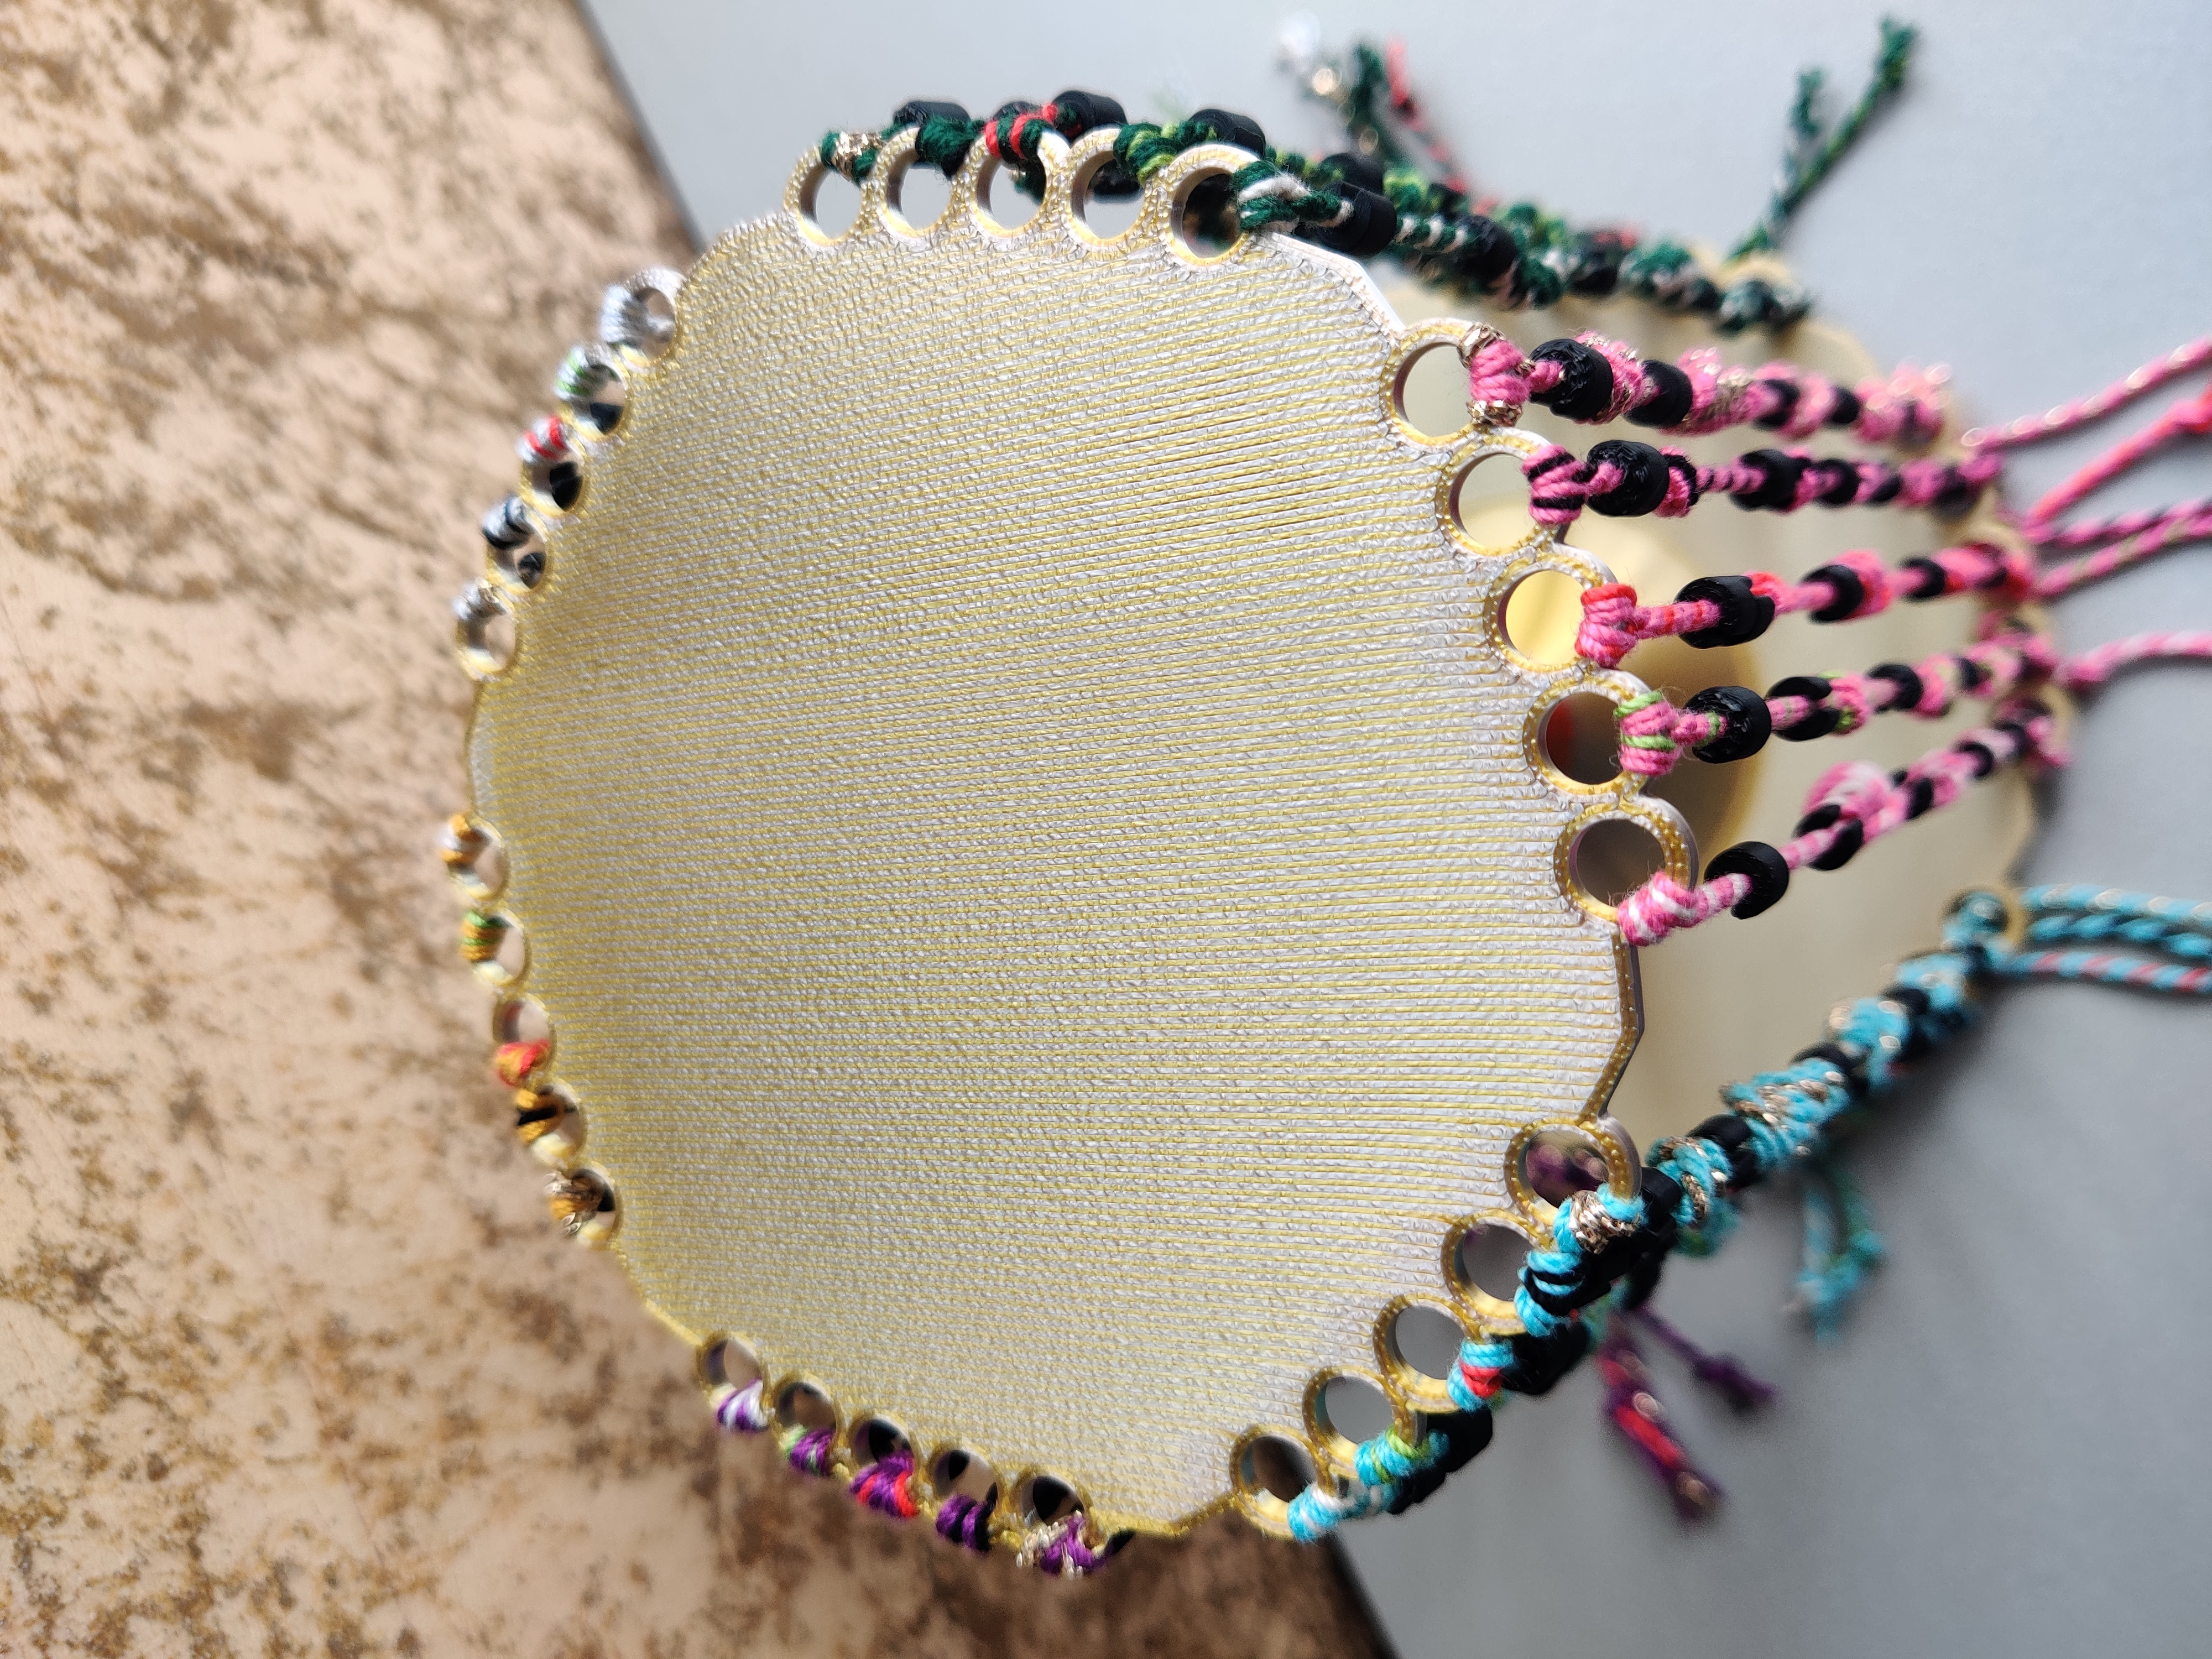
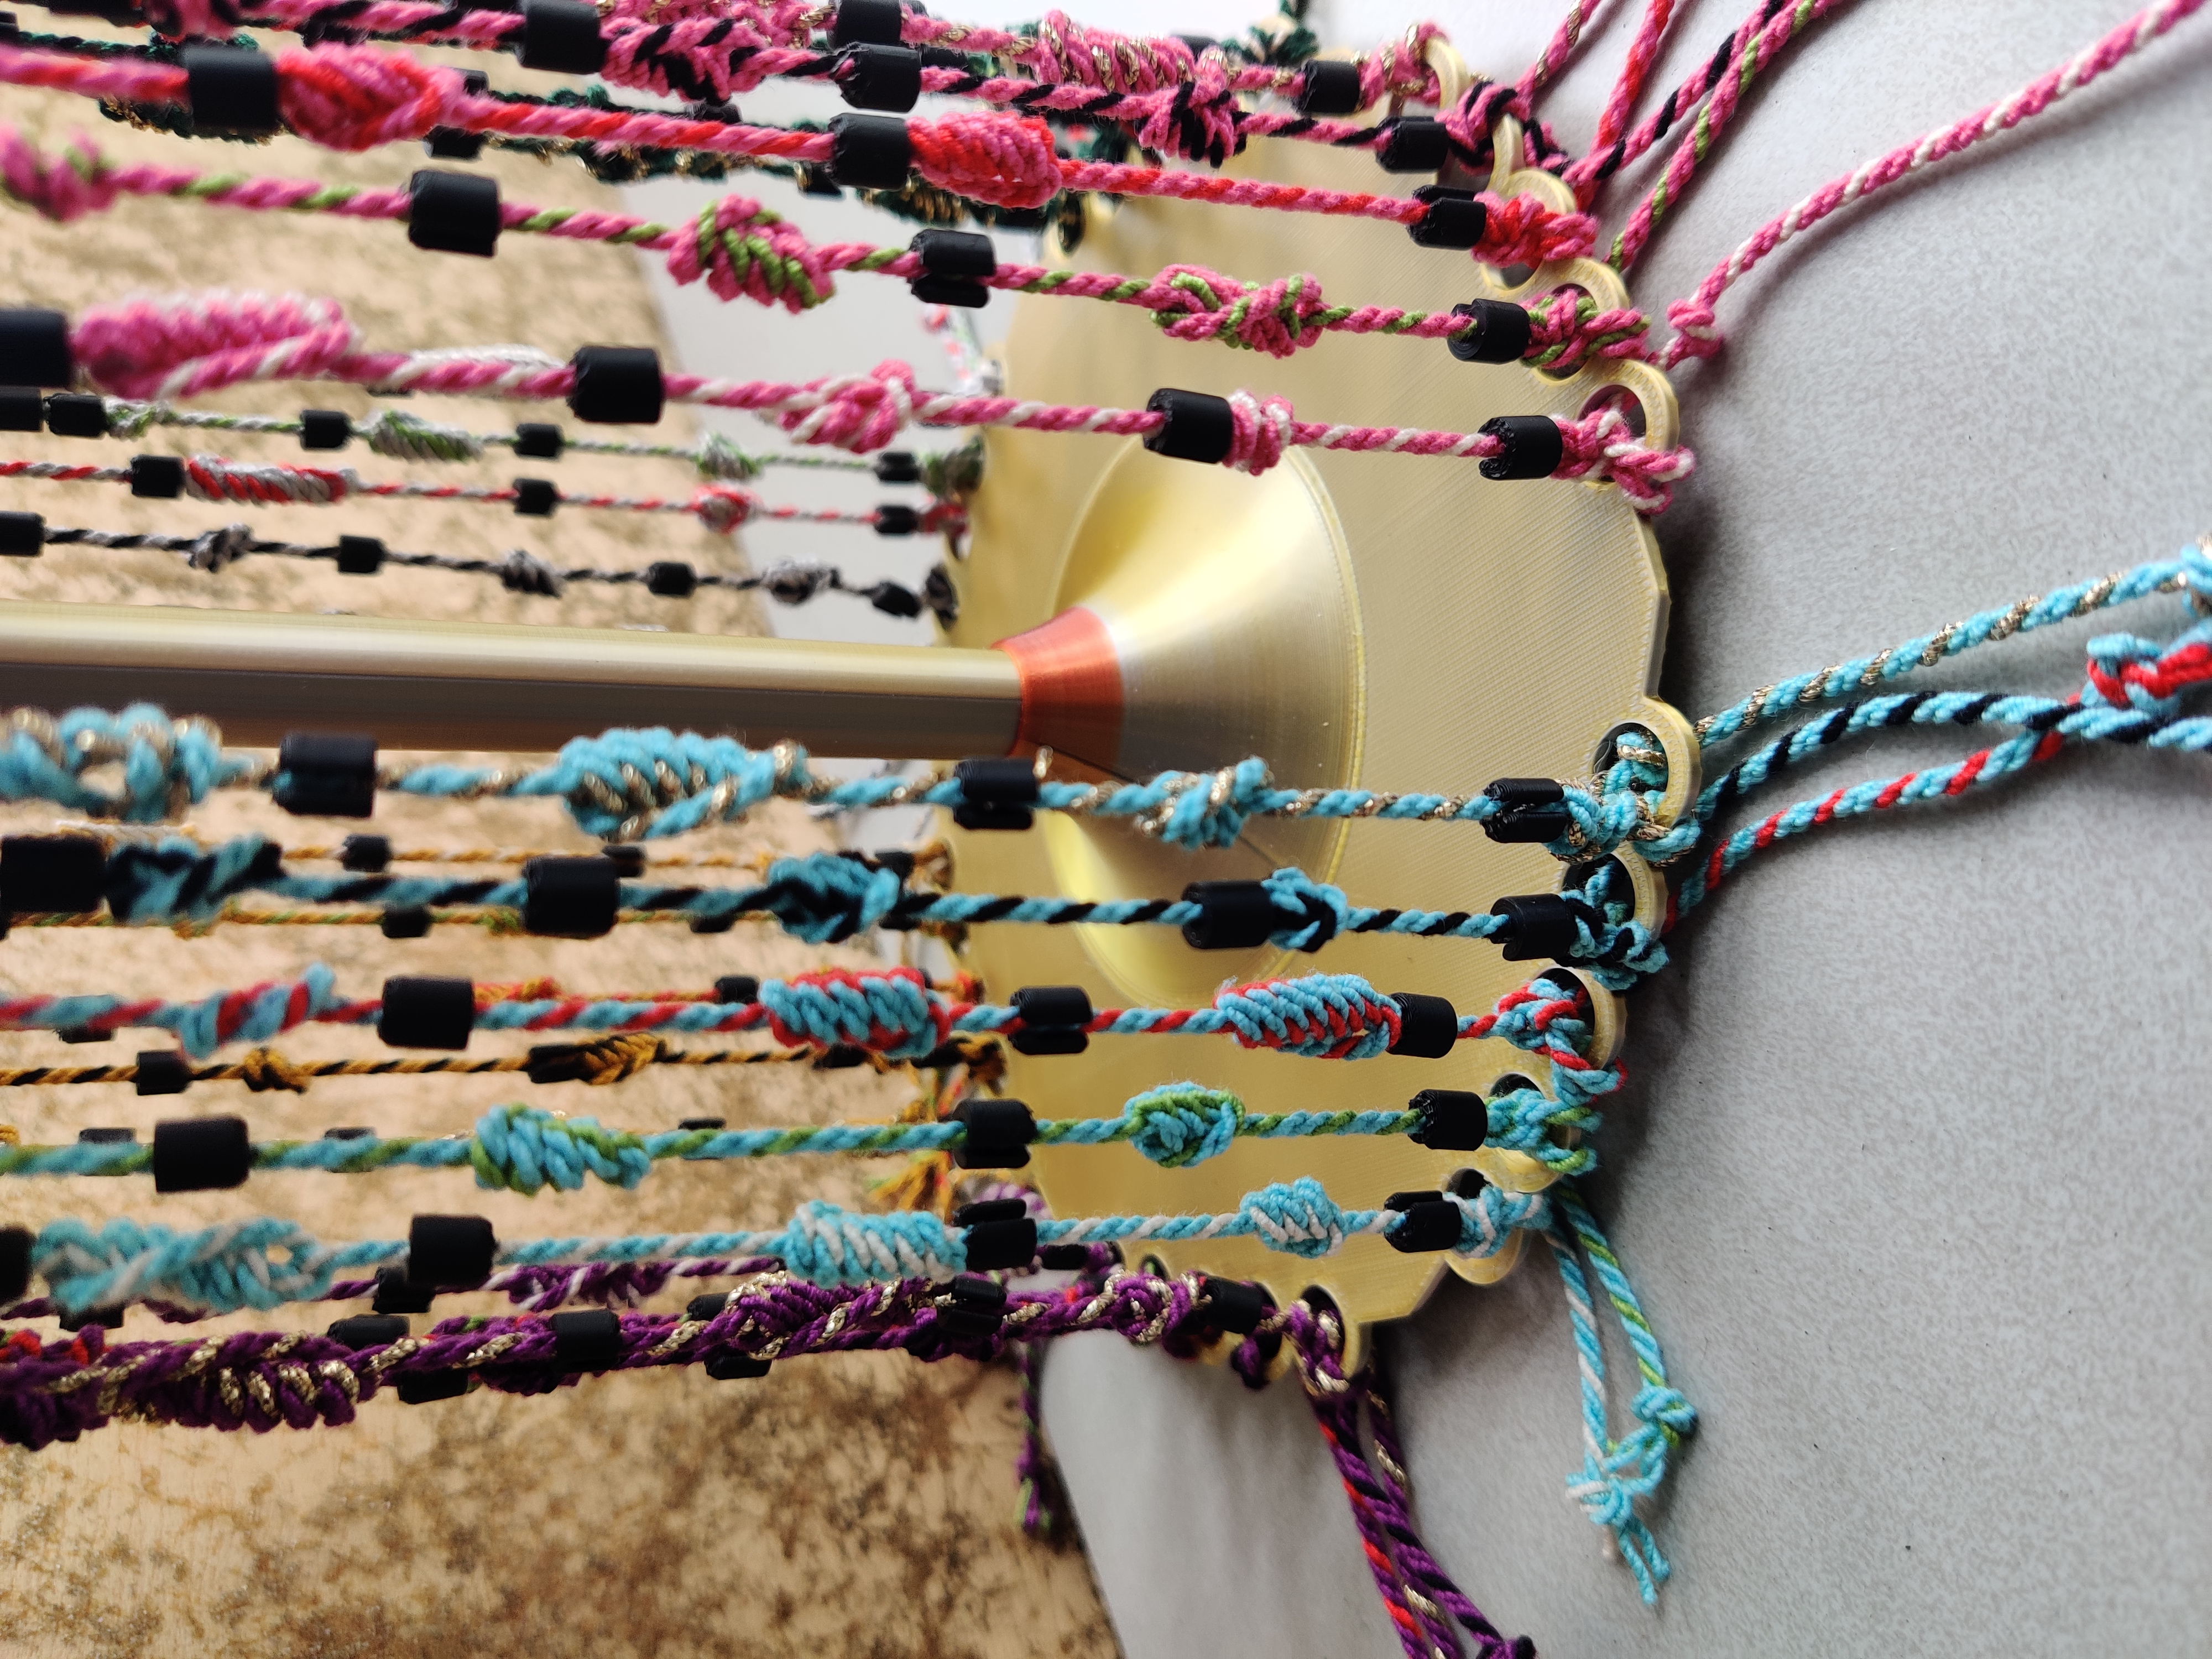
The column is made out of 3 3D-printed parts - hopefully this makes it easier to post:
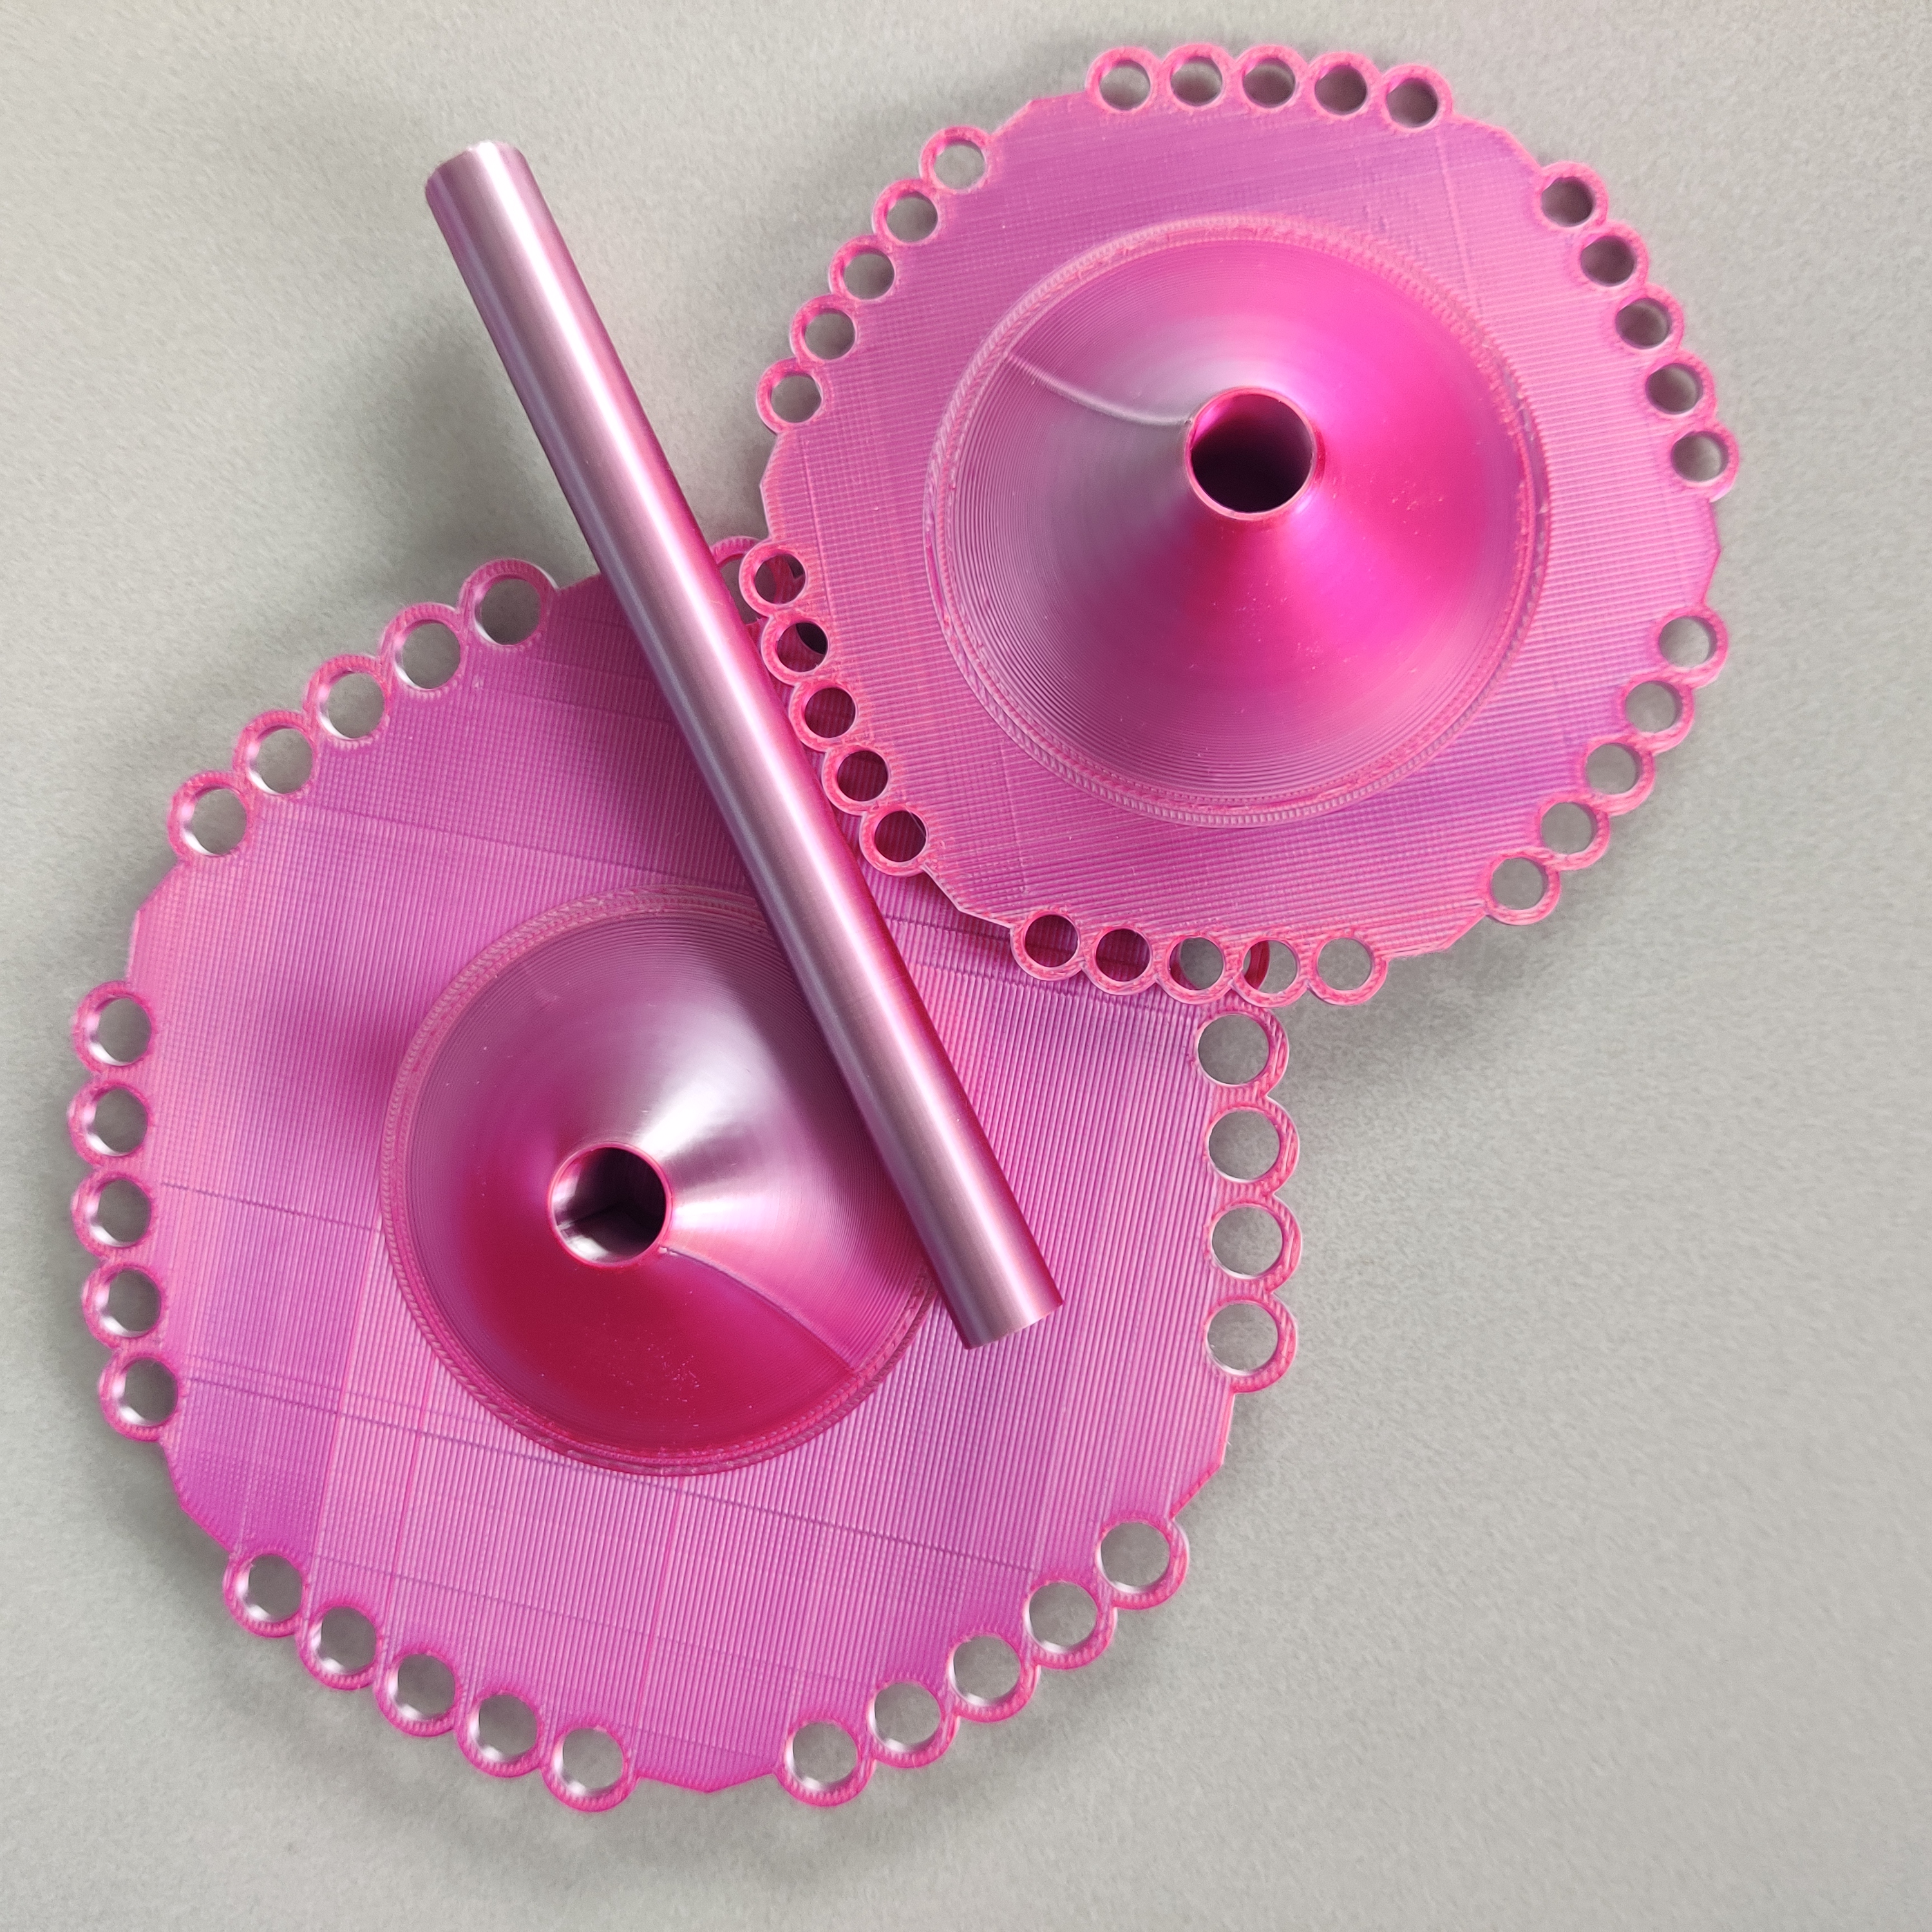
I also used spacer beads on the cords. The STL files for all the parts are here, in case you need to print any more for any reason:
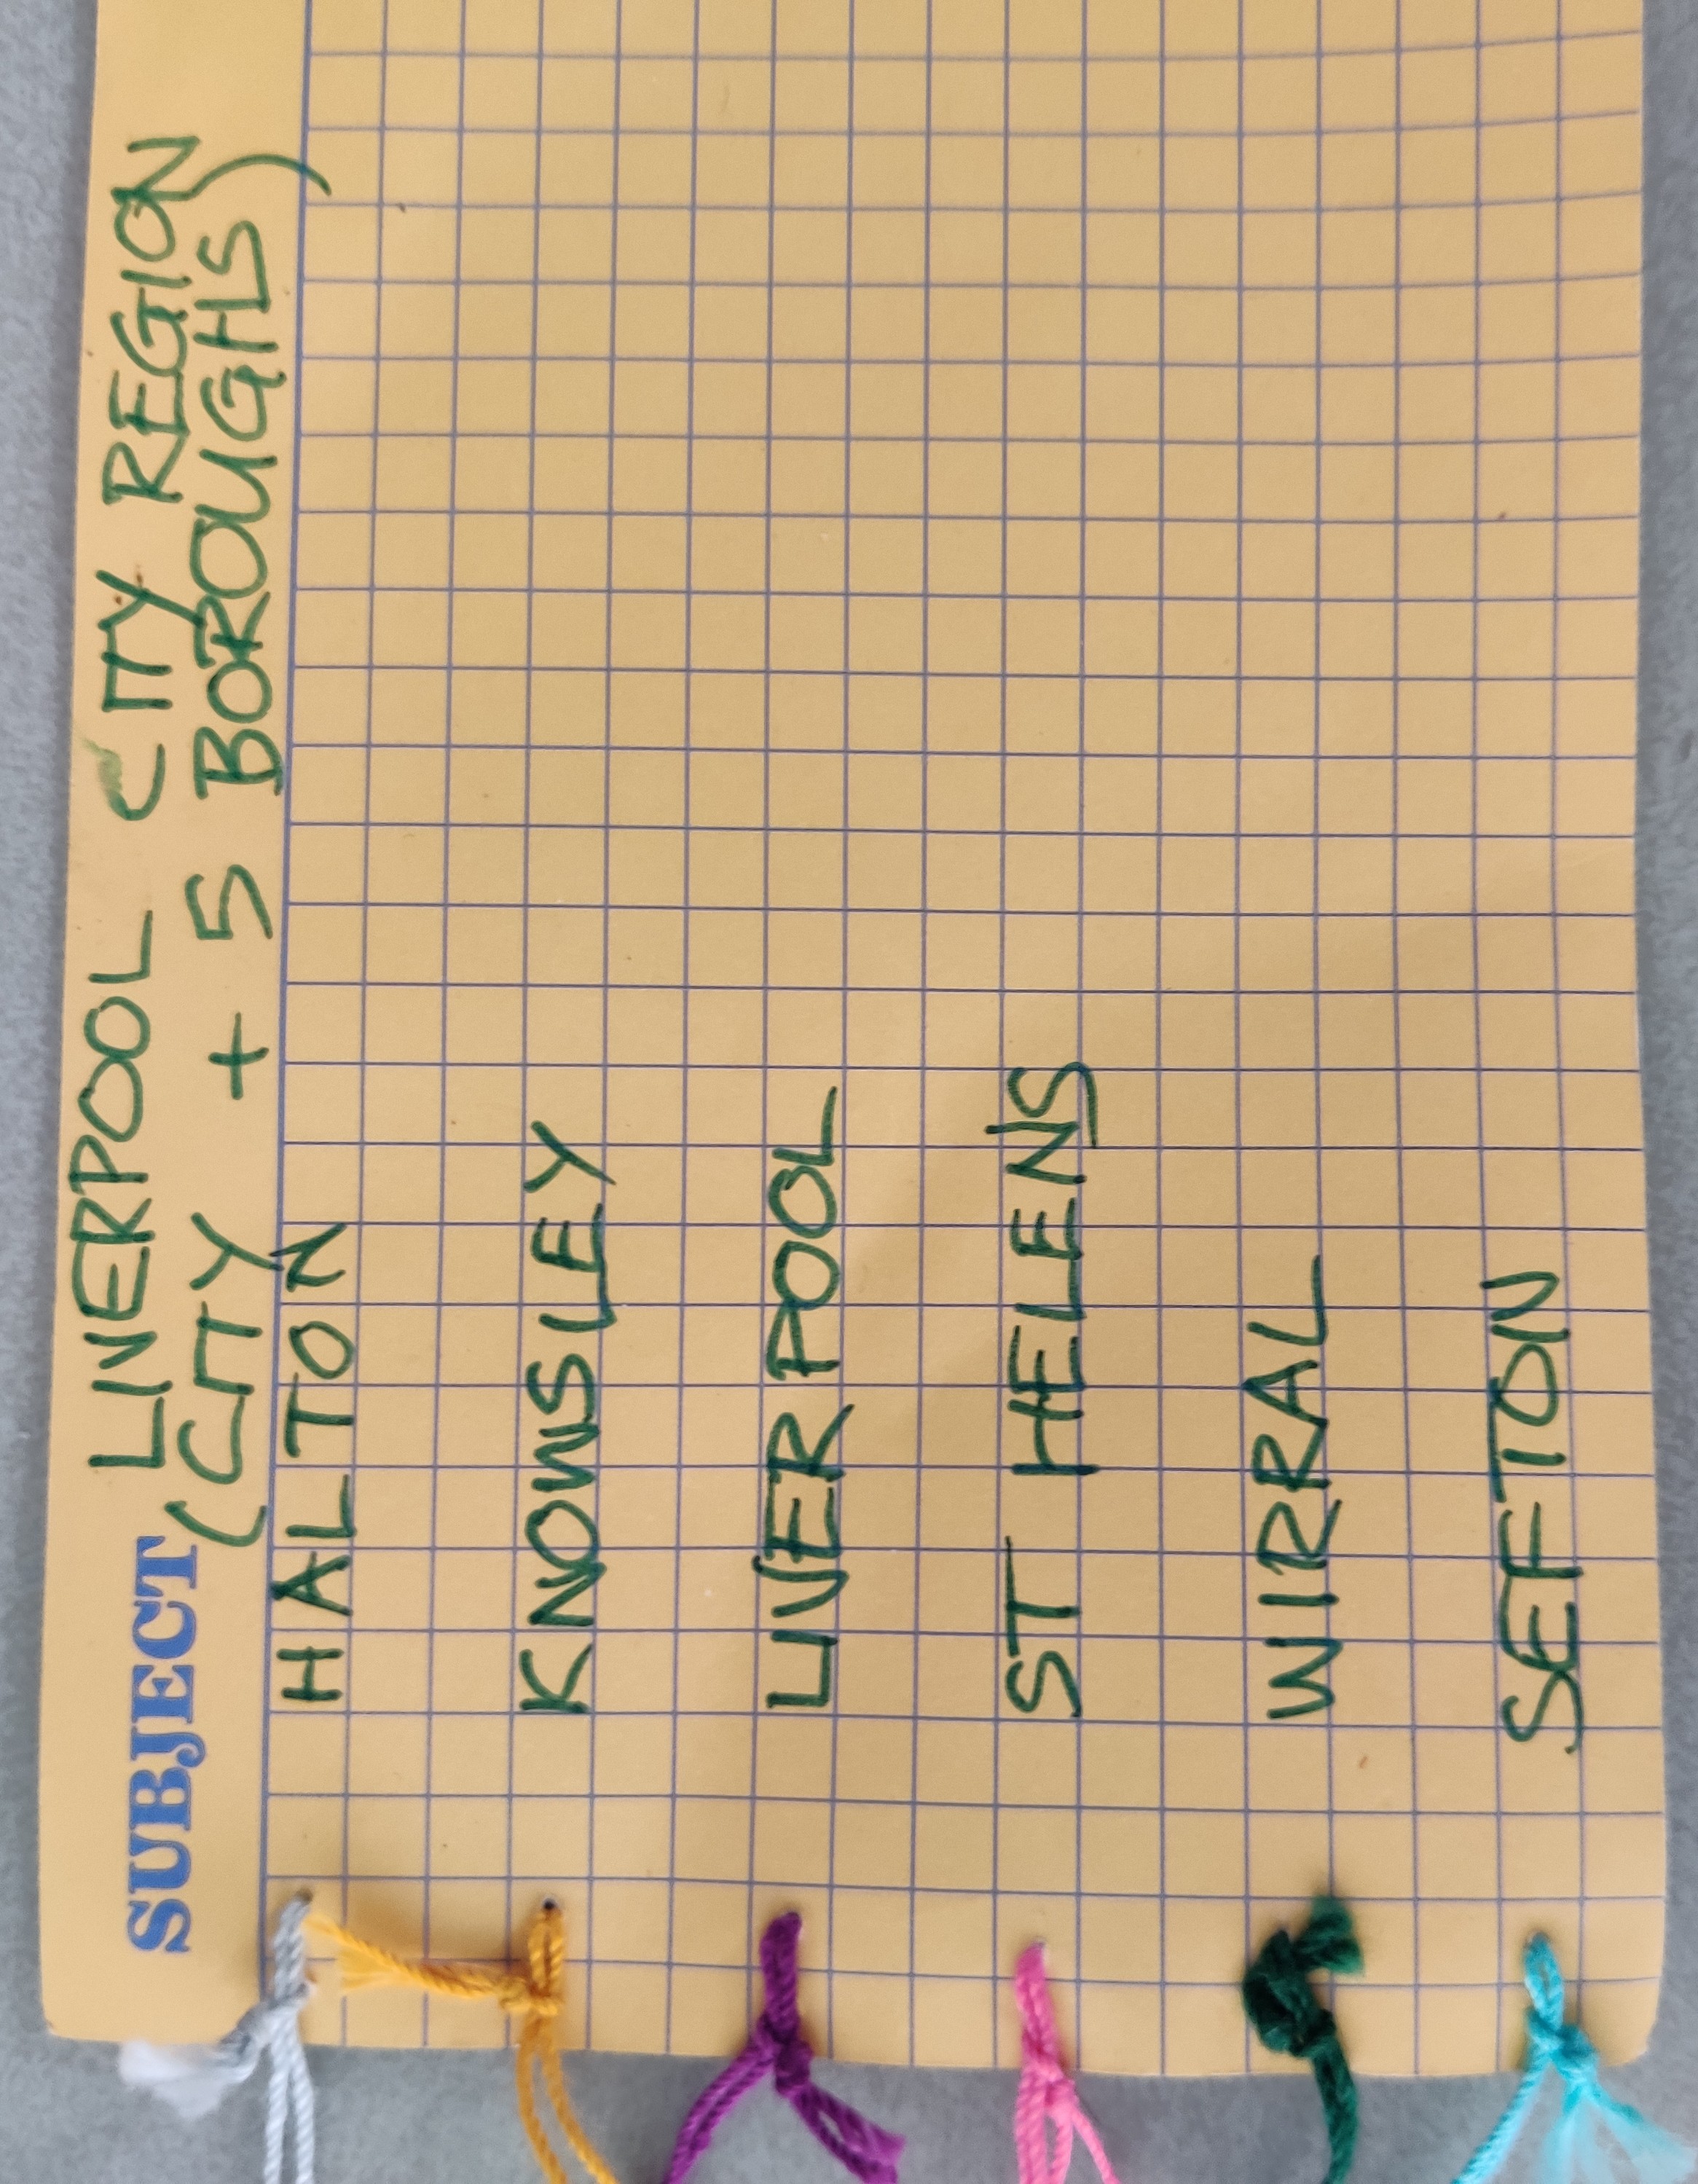
It has 6 sides, one for the City of Liverpool and one each for the 5 boroughs in the Liverpool City Regions. Each was represented by a colour: Halton - Light Grey, Knowsley - Gold, Liverpool - Purple, Sefton - Sky Blue, Wirral - Dark Green (I tried to use the nearest crochet cotton colour to the official colour of each entity):
The data I used was from the MLDS, or Minimum Digital Living Standard, “the minimum basket of digital goods, services, and skills that households need to live and participate in the digital world” which had been developed by the team running the Festival. I chose to use data for households with children, and this is the data I ended up showing (please excuse any transcription errors in the table and the quipus!):
| Entity | Not having adequate broadband (%) | Not having adequate number of large screen devices (%) | Not having adequate Smart TV access (%) | Not having adequate equipment (%) | Failing MDLS (%) |
|---|---|---|---|---|---|
| Halton | 5.85 | 2.64 | 1.83 | 12.34 | 40.63 |
| Knowsley | 6.03 | 2.60 | 1.79 | 12.51 | 40.55 |
| Liverpool | 5.78 | 3.64 | 2.64 | 14.31 | 38.93 |
| Sefton | 7.63 | 2.43 | 1.57 | 13.32 | 39.68 |
| St Helens | 7.12 | 2.46 | 1.45 | 12.50 | 39.98 |
| Wirral | 7.89 | 2.53 | 1.40 | 13.29 | 39.98 |
The category “Not having adequate equipment” is the total for all equipment types; they aren’t all included here. “Failing MDLS” is the total number of households not meeting the MDLS; you can see that the values are much higher than those for equipment only, so obviously lack of skills was more important - it was more difficult to find this data though. It also looks as though some of the data here has been averaged. In general the numbers are pretty similar for each of the entities and, if I was doing this again, I might choose different areas of the country, rather than one region, with the hope of showing more differances.
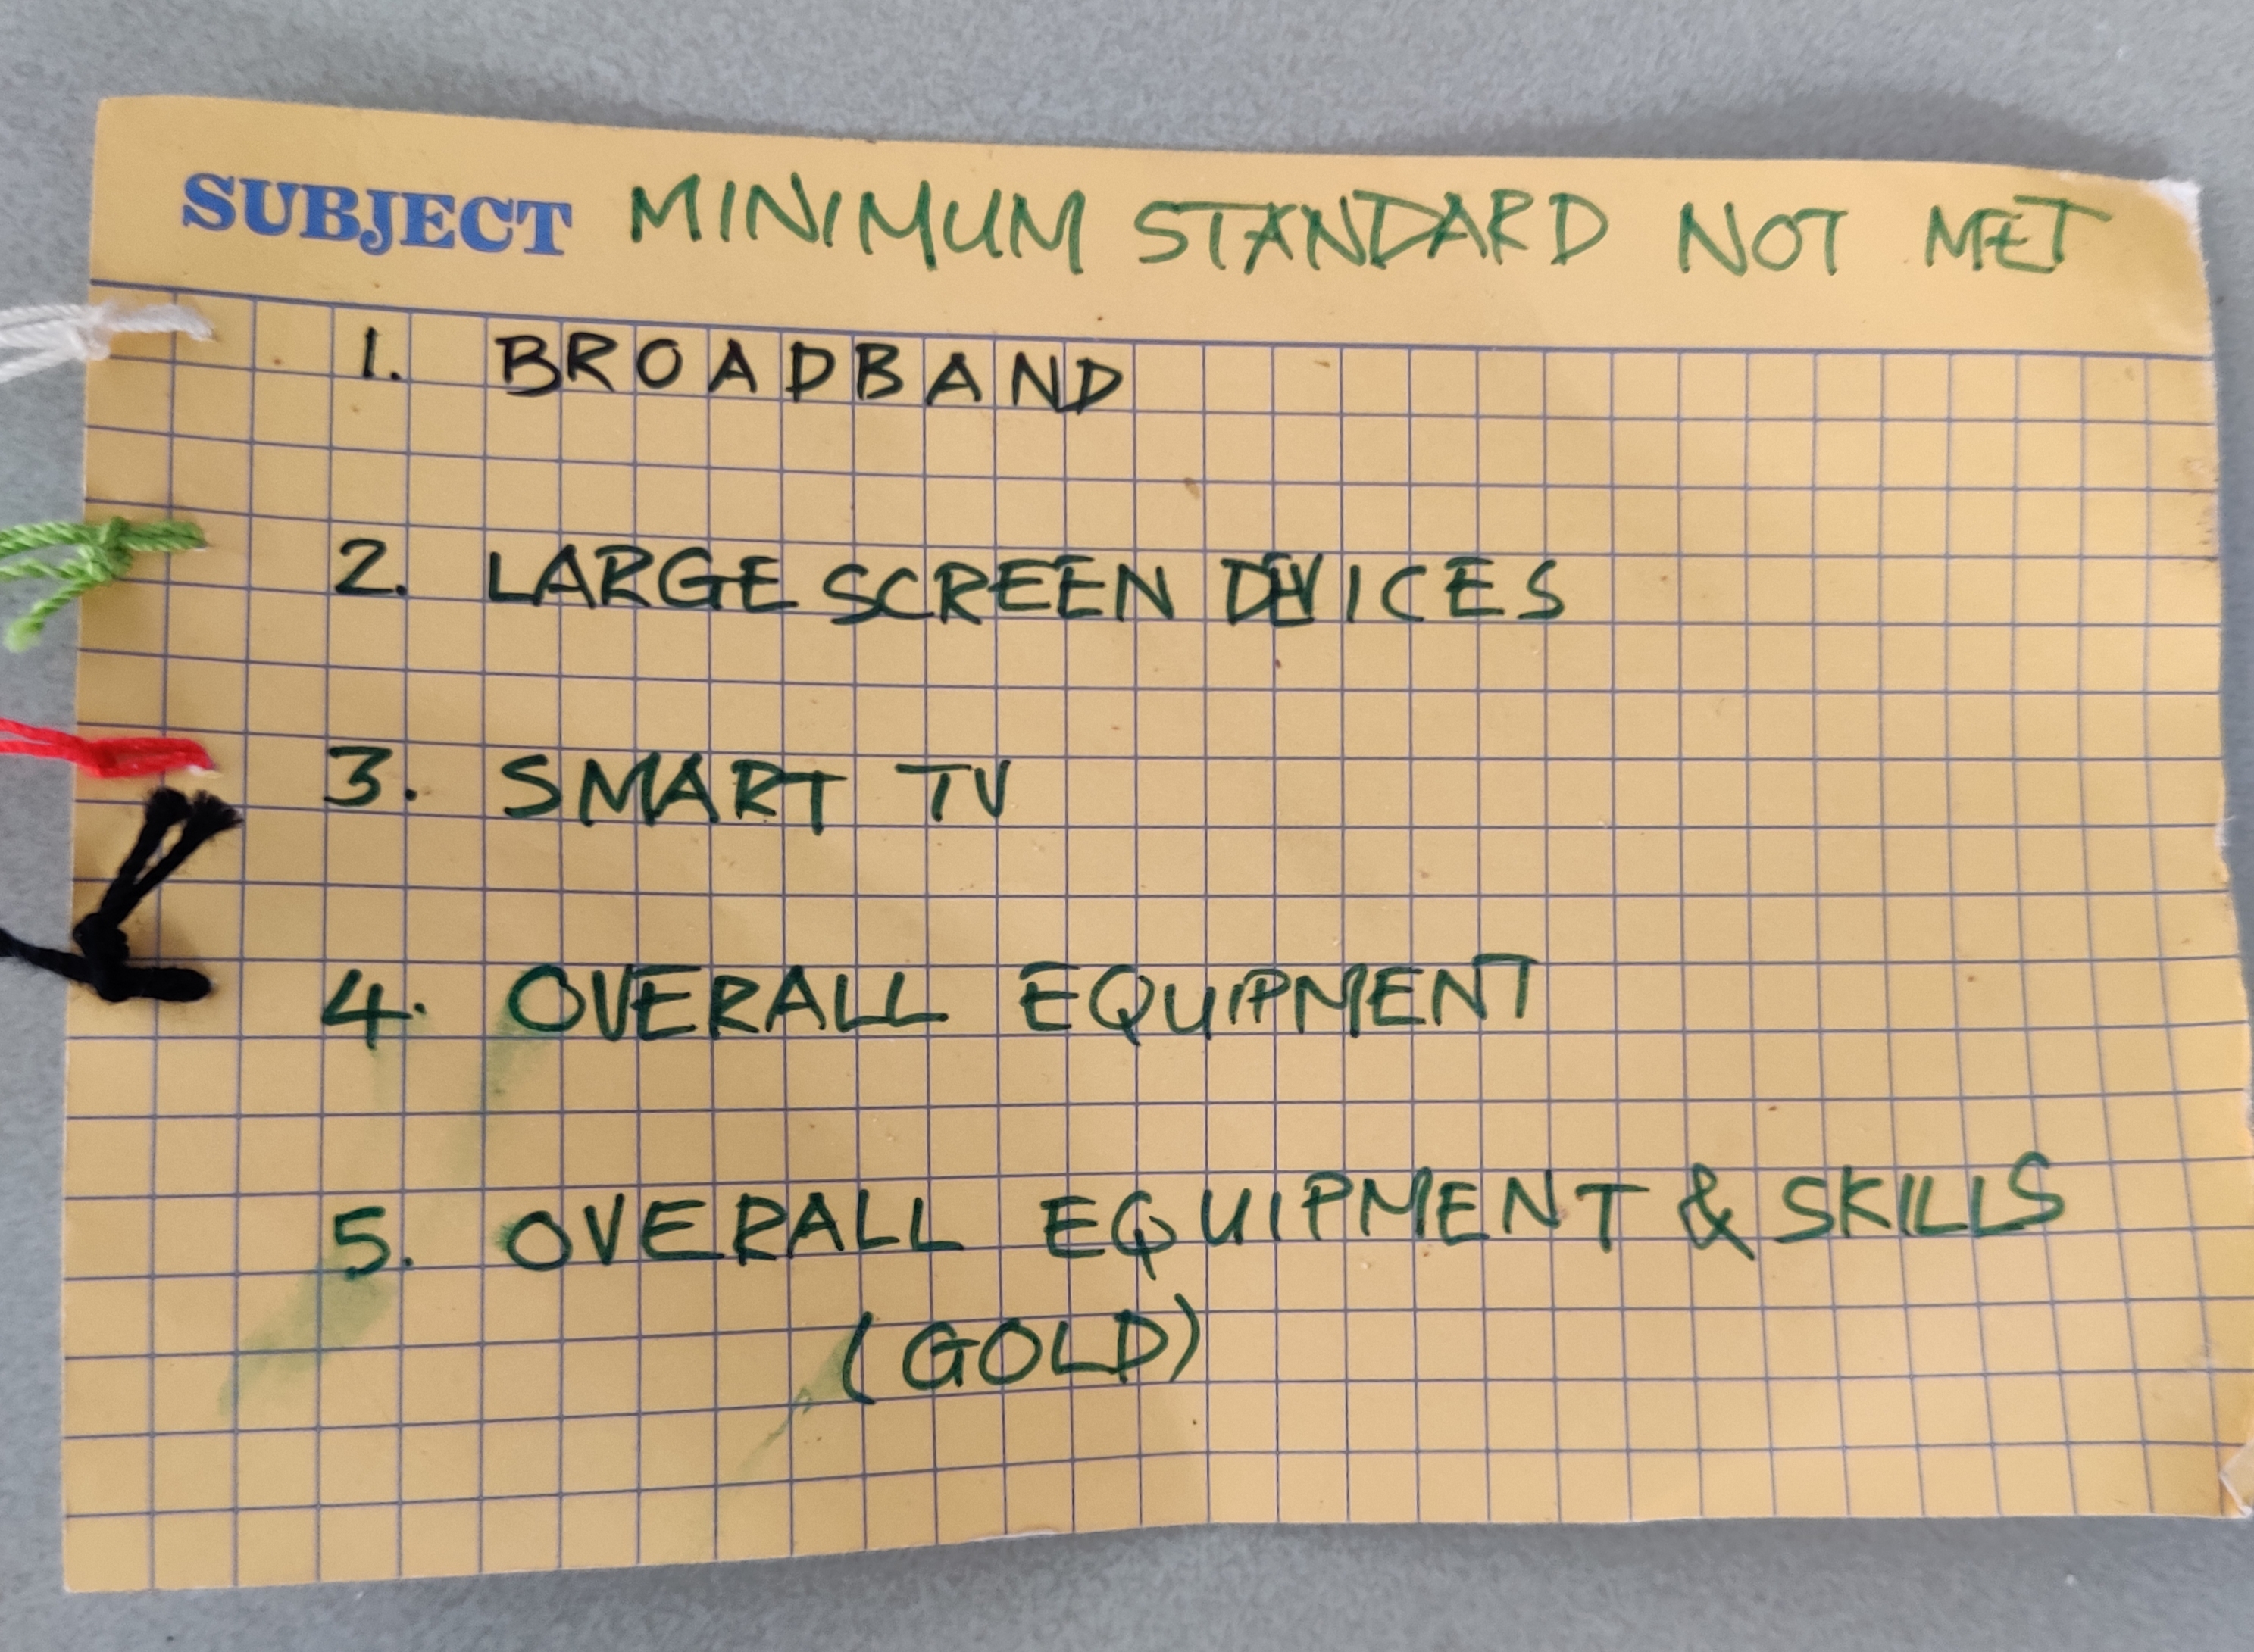
I assigned a colour to each of these categories too (Broadband - Off-White, Large screen devices - Light Green, Smart TV - Red, Total Equipment - Black, Total MDLS - Gold):
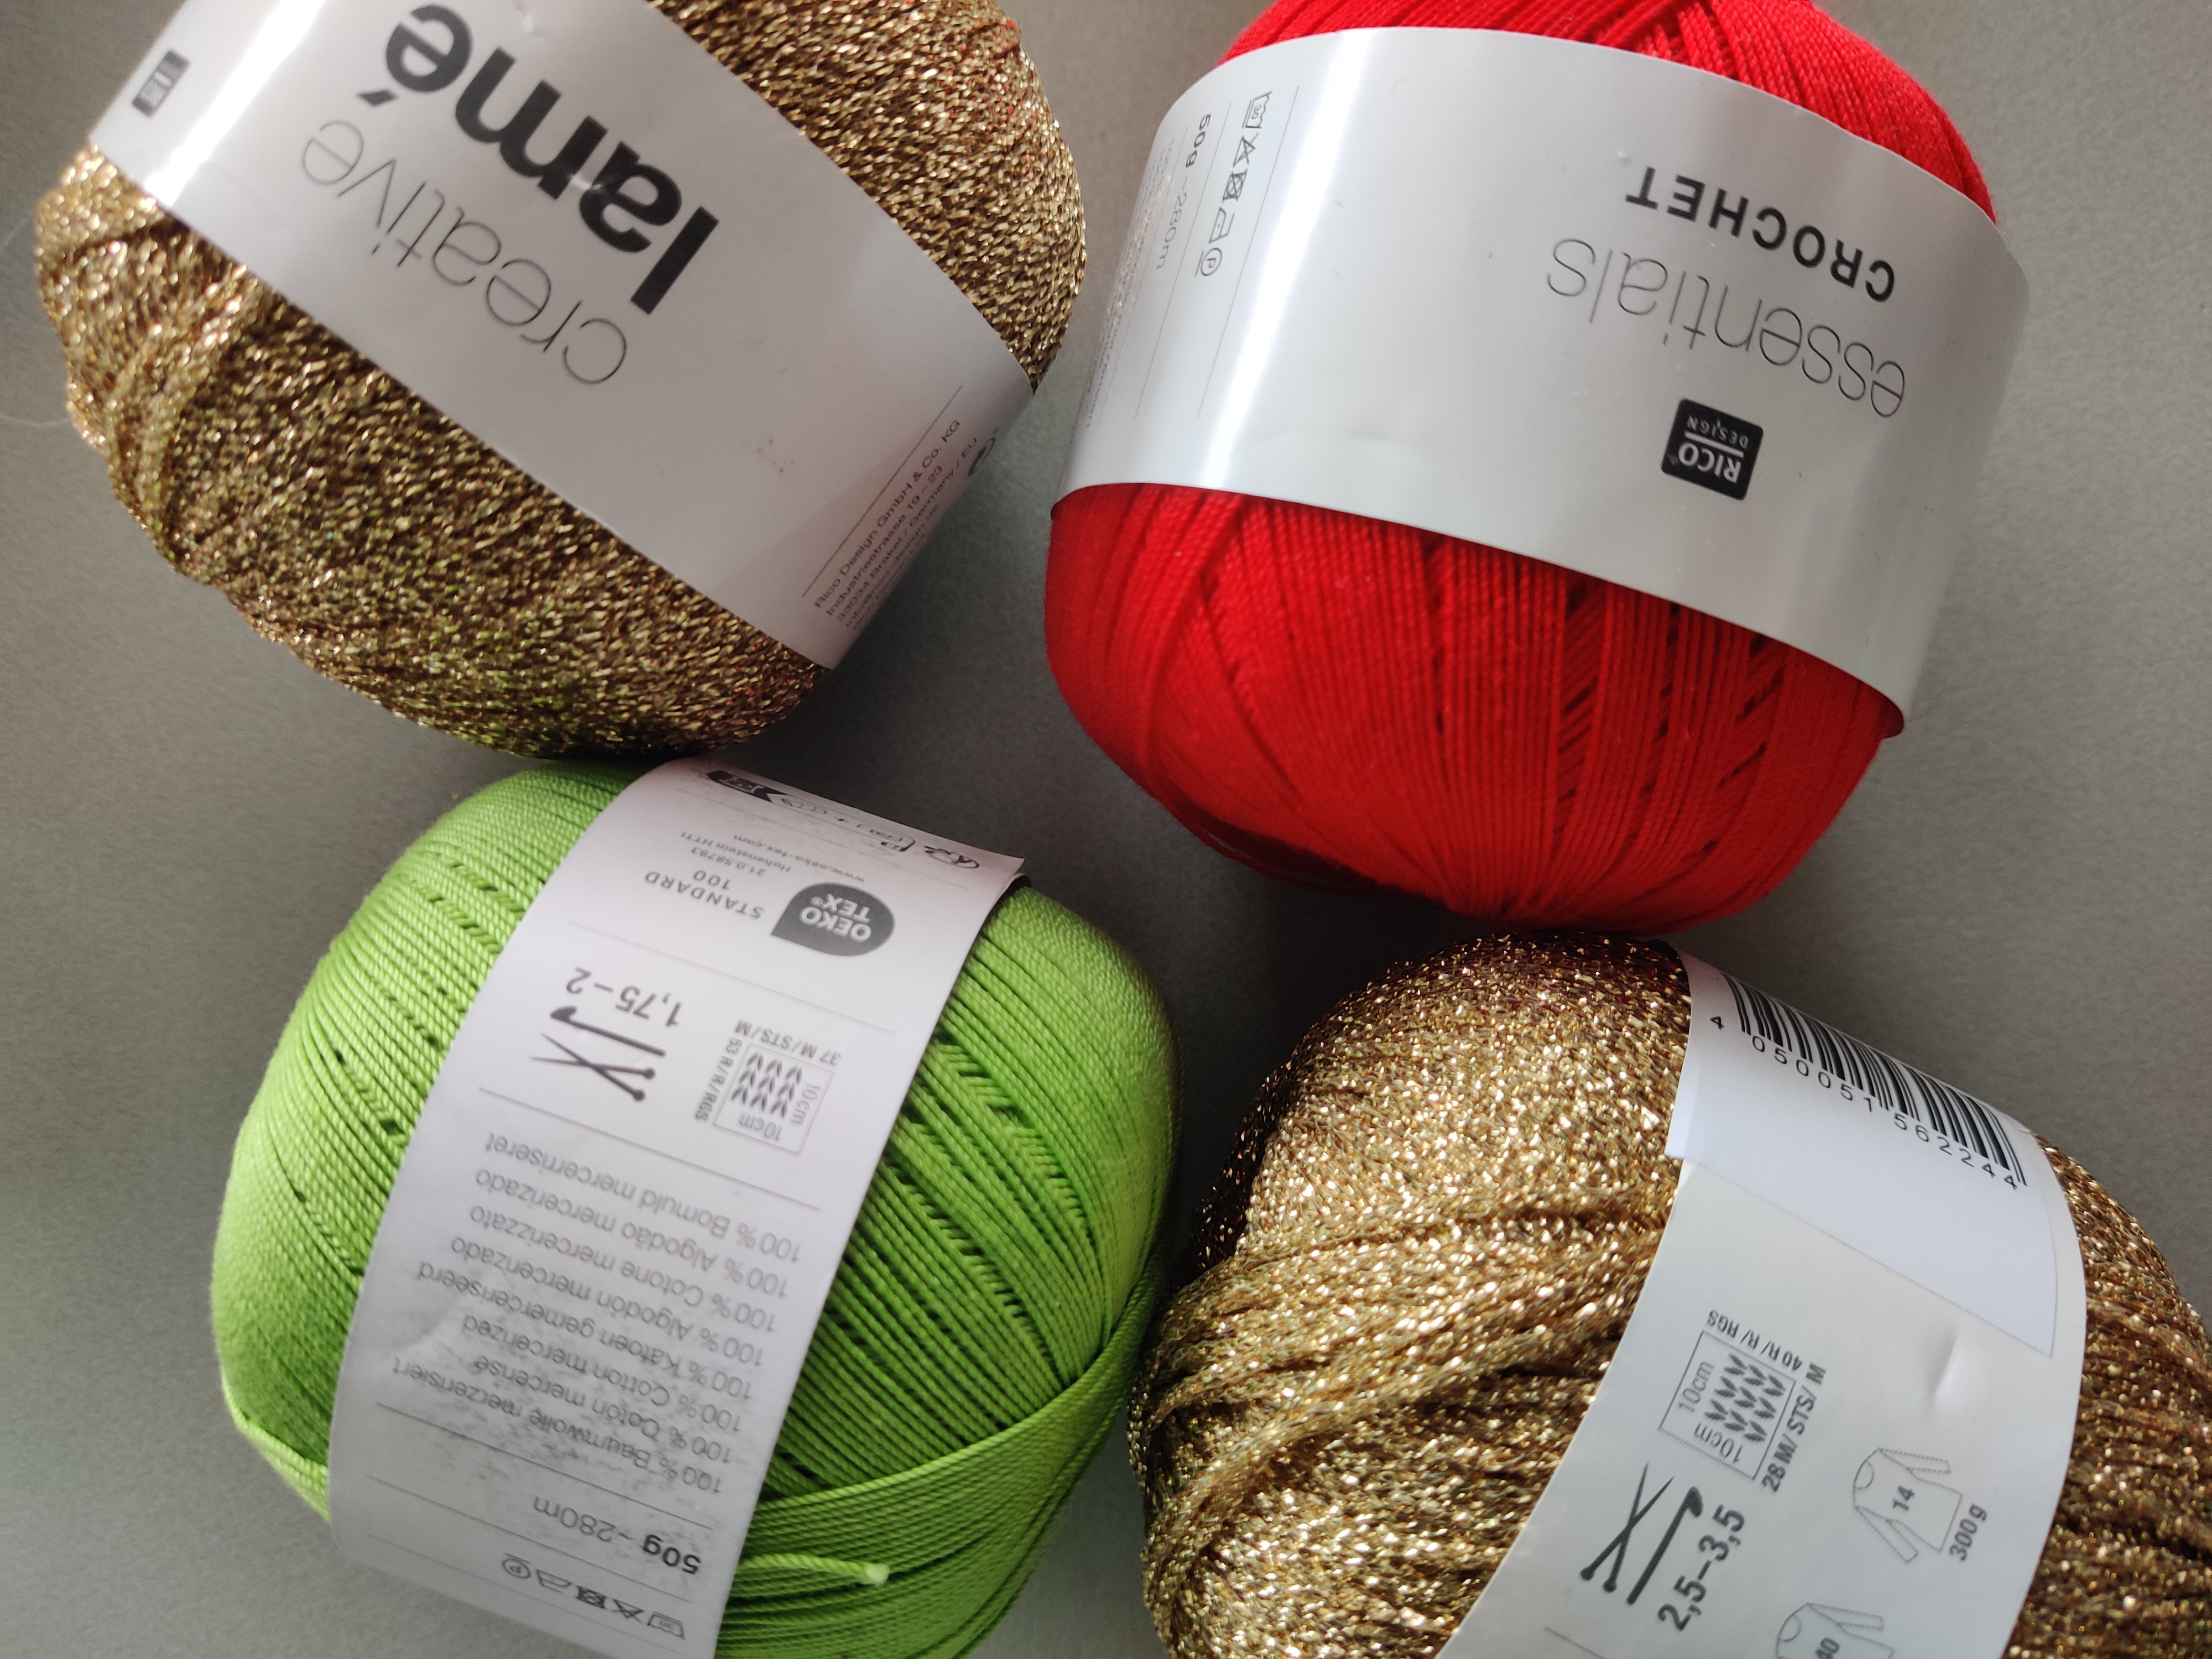
I then made a cord for each combination using two strands of crochet cotton for the area and one for the category e.g. 2 strands of Dark Green and one of Red to represent number of households with children in the Wirral who don’t have adequate Smart TV access. Here’s the type of cotton I used:
I used a 3D-printed drill attachment to twist the cotton, although you can twist it by hand or use an electric hair braider if you have one.
I then made knots in each cord to represent the percentages, using the Quipu knotting system, an information recording method used by several South American Cultures (I had originally intended to create bar chart style patterns, but was easily persuaded by Quipu, especially as the Inca Empire had managed to collect their taxes using a Quipu database!). Here are the knots I used:
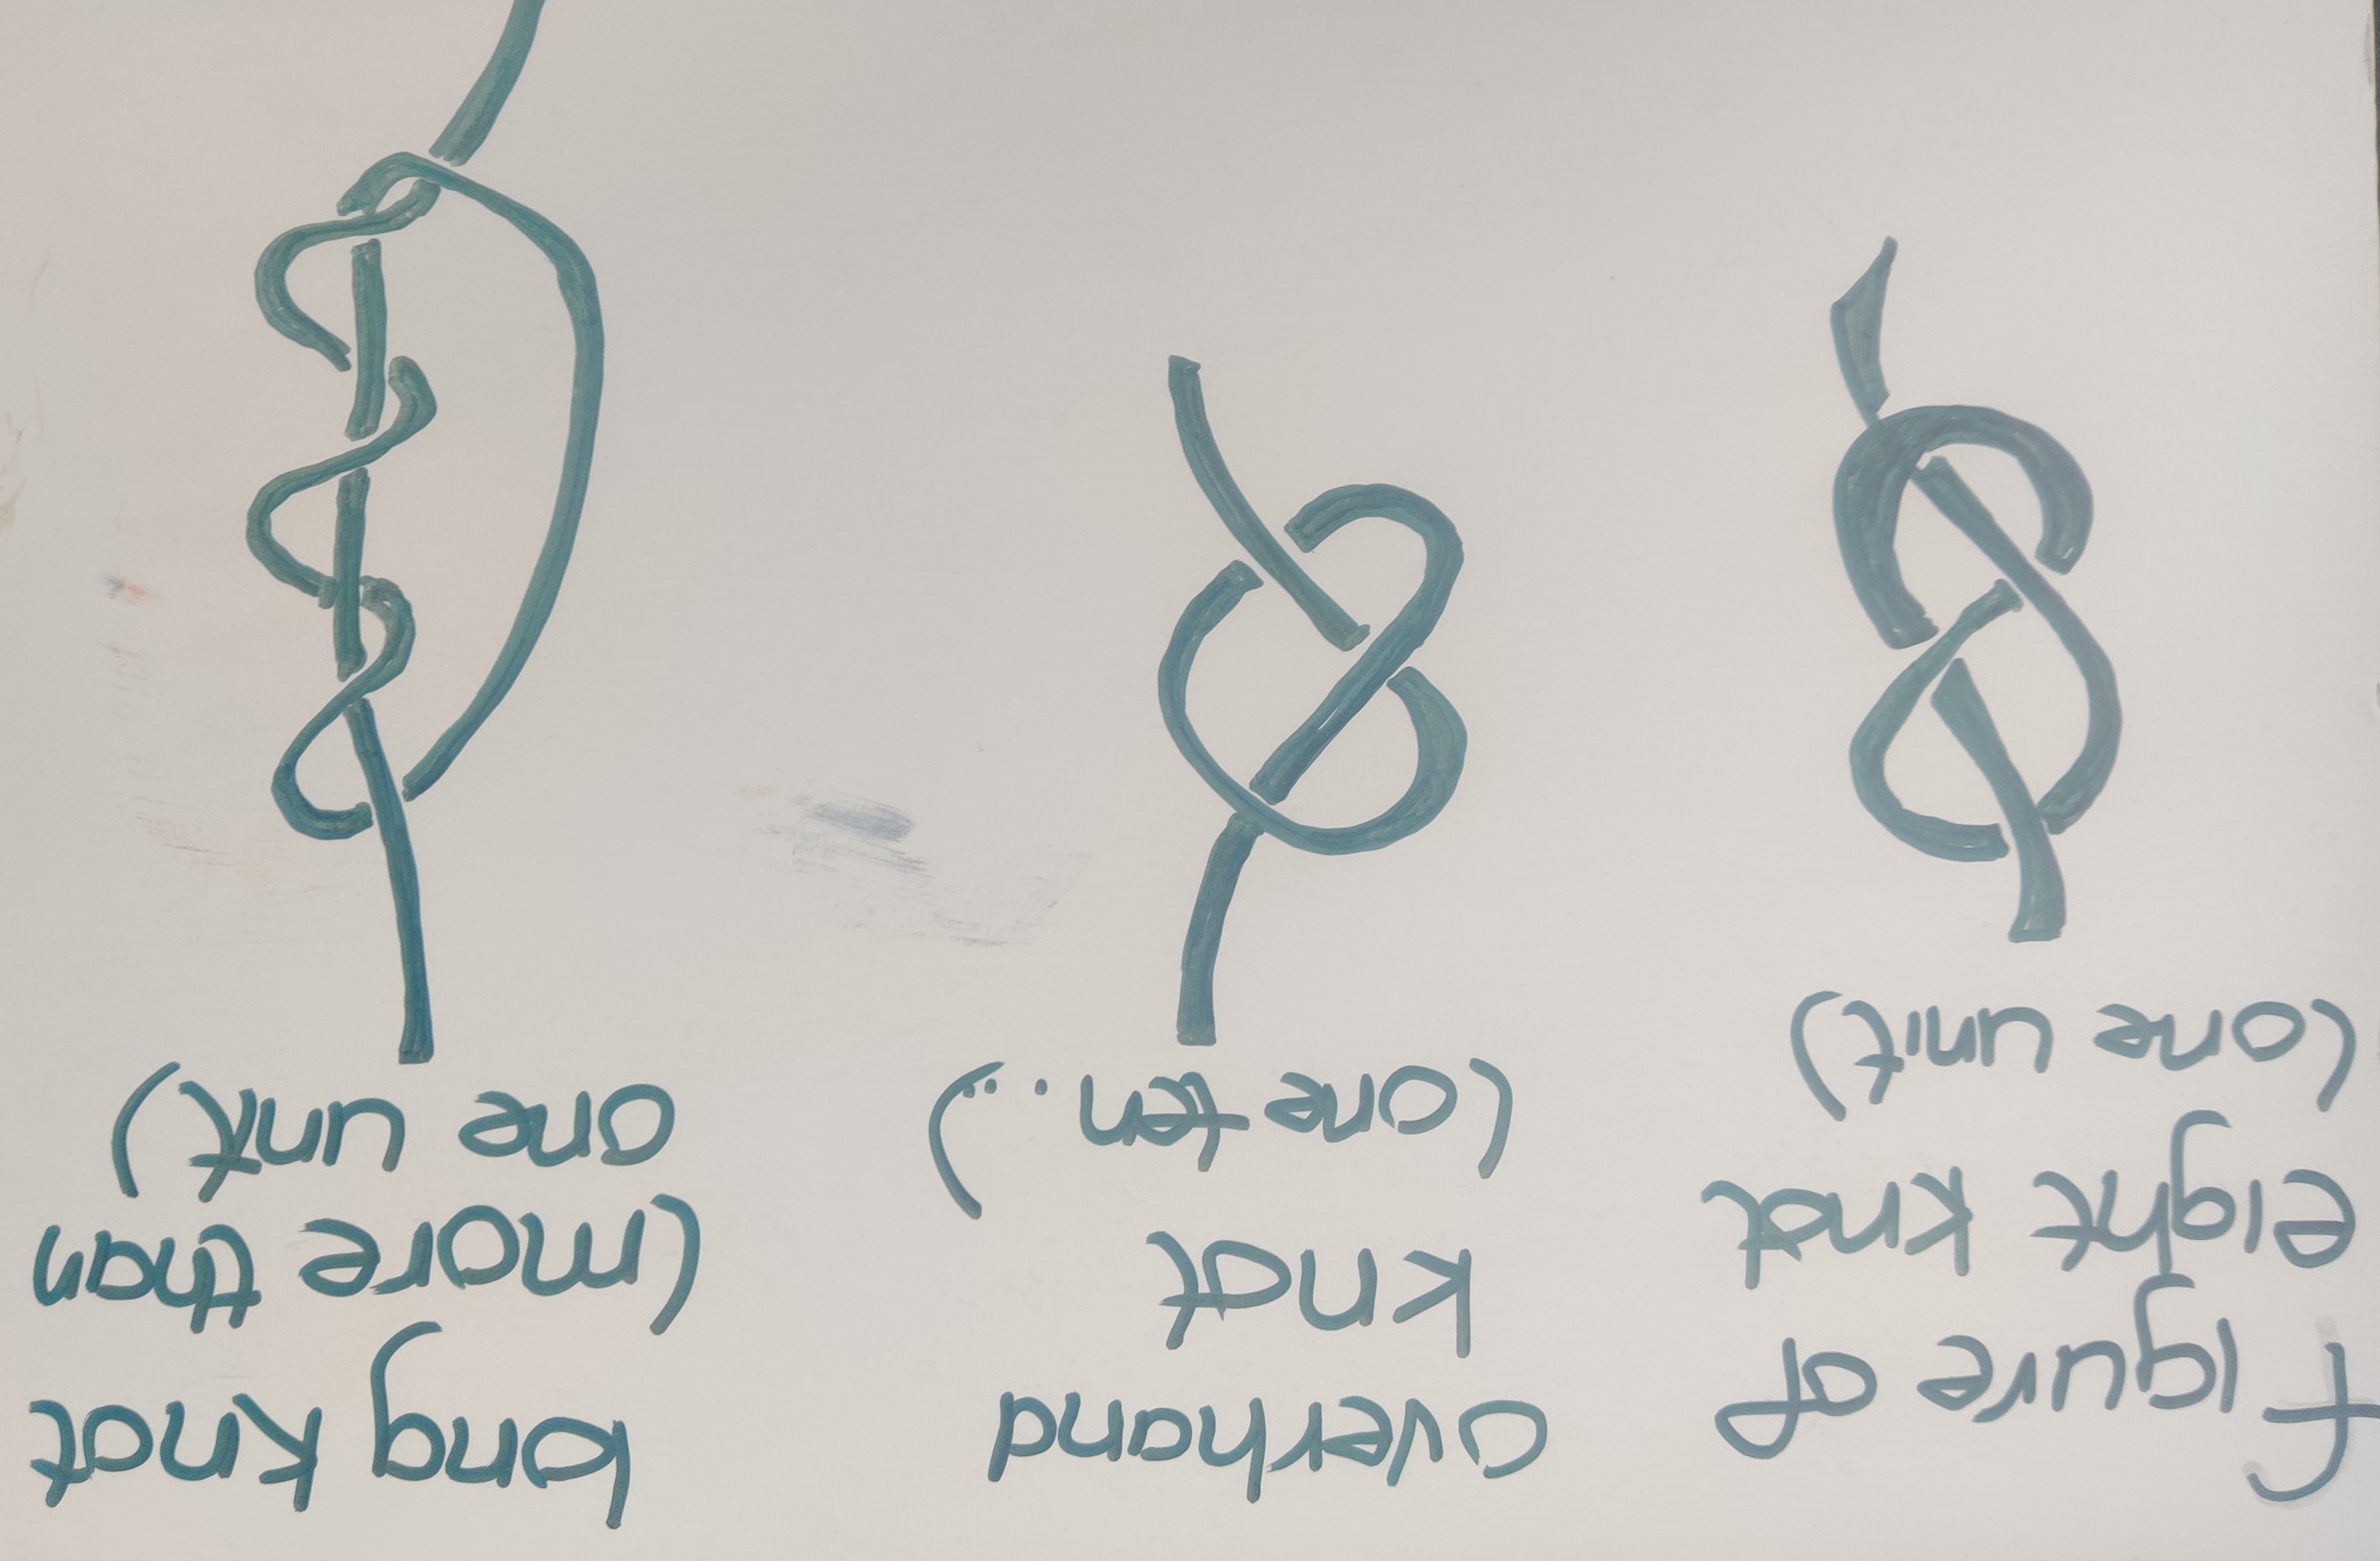
You can see that the knots used in the units and tens positions are different. I’m not sure if Inca tax collectors had to count half fields or llamas, but I’ve used the same knots for places after the decimal point as I have for units. I’ve also used 3D printed beads as spacers between places, as my work wasn’t very clear when there were zeros in the numbers - that might be a skill thing, as I had to do it in the large column too.
This page gives a good introduction to twisting and knotting, using a different twisting tool.
What I acheived
I only managed to make one complete model - I don’t know why I was surprised that a small model, with exactly the same number of twisted cords and knots as a larger version, would take around the same time to build! Maybe it just needs practice - Incas and modern day hair braiders could probably do it quicker.
However, I did print several sets of the 3D printed parts, and Mike G, another member of the DoES Liverpool community, helped by printing the rest on his home 3D printer, so I was able to post the required number to Sara in Virginia, and hopefully they’ll get sent out with the other makes soon.
If you’ve got any sets of data with 5 categories for each of 6 areas (or 6 categories for each of 5 areas) then this column might work for you, but it could also be used as the basis for something else. This Instagram user’s Quipu-inspired interior decoration inspires me to try something more freestyle next. And I’d love to know if anyone is inspired by this project.